1993-11
1993-12
1994-1
1994-2
1994-3
1994-4
1994-5
1994-6
1994-7
1994-8
1994-9
1994-10
1994-11
1994-12
1995-1
1995-2
1995-3
1995-4
1995-5
1995-6
1995-7
1995-8
1995-9
1995-10
1995-11
1995-12
1996-1
1996-2
1996-3
1996-4
1996-5
1996-6
1996-7
1996-8
1996-9
1996-10
1996-11
1996-12
1997-1
1997-2
1997-3
1997-4
1997-5
1997-6
1997-7
1997-8
1997-9
1997-10
1997-11
1997-12
1998-1
1998-2
1998-3
1998-4
1998-5
1998-6
1998-7
1998-8
1998-9
1998-10
|
2.32
2.09
2.41
2.59
2.08
2.04
1.87
1.96
1.88
1.59
1.47
1.54
1.53
1.69
1.52
1.59
1.54
1.63
1.64
1.62
1.44
1.56
1.64
1.77
2.04
2.71
2.96
4.56
2.95
2.23
2.24
2.49
2.50
2.04
1.84
2.37
3.03
3.82
3.32
2.22
1.89
2.03
2.24
2.20
2.19
2.48
2.85
3.04
3.02
2.33
2.10
2.22
2.24
2.43
2.15
2.17
2.17
1.85
2.02
1.89
| | |
| |
1998-11
1998-12
1999-1
1999-2
1999-3
1999-4
1999-5
1999-6
1999-7
1999-8
1999-9
1999-10
1999-11
1999-12
2000-1
2000-2
2000-3
2000-4
2000-5
2000-6
2000-7
2000-8
2000-9
2000-10
2000-11
2000-12
2001-1
2001-2
2001-3
2001-4
2001-5
2001-6
2001-7
2001-8
2001-9
2001-10
2001-11
2001-12
2002-1
2002-2
2002-3
2002-4
2002-5
2002-6
2002-7
2002-8
2002-9
2002-10
2002-11
2002-12
2003-1
2003-2
2003-3
2003-4
2003-5
2003-6
2003-7
2003-8
2003-9
2003-10
|
2.11
1.73
1.85
1.78
1.79
2.15
2.26
2.31
2.31
2.79
2.54
2.73
2.36
2.36
2.42
2.66
2.79
3.04
3.58
4.29
3.96
4.41
5.06
5.02
5.54
8.95
8.18
5.62
5.16
5.17
4.21
3.71
3.11
2.96
2.15
2.45
2.37
2.42
2.26
2.31
3.03
3.43
3.50
3.23
2.99
3.09
3.55
4.12
4.03
4.75
5.44
7.78
5.95
5.28
5.82
5.82
5.03
4.97
4.62
4.65
| | |
| |
2003-11
2003-12
2004-1
2004-2
2004-3
2004-4
2004-5
2004-6
2004-7
2004-8
2004-9
2004-10
2004-11
2004-12
2005-1
2005-2
2005-3
2005-4
2005-5
2005-6
2005-7
2005-8
2005-9
2005-10
2005-11
2005-12
2006-1
2006-2
2006-3
2006-4
2006-5
2006-6
2006-7
2006-8
2006-9
2006-10
2006-11
2006-12
2007-1
2007-2
2007-3
2007-4
2007-5
2007-6
2007-7
2007-8
2007-9
2007-10
2007-11
2007-12
2008-1
2008-2
2008-3
2008-4
2008-5
2008-6
2008-7
2008-8
2008-9
2008-10
|
4.47
6.15
6.15
5.39
5.38
5.71
6.29
6.30
5.93
5.44
5.11
6.39
6.16
6.62
6.13
6.13
6.92
7.20
6.49
7.16
7.64
9.46
11.88
13.42
10.28
13.05
8.68
7.54
6.89
7.16
6.24
6.22
6.15
7.15
4.91
5.77
7.40
6.82
6.55
7.98
7.10
7.59
7.63
7.36
6.21
6.23
6.08
6.80
7.14
7.14
7.98
8.55
9.44
10.13
11.26
12.69
11.06
8.25
7.67
6.73
| | |
| |
2008-11
2008-12
2009-1
2009-2
2009-3
2009-4
2009-5
2009-6
2009-7
2009-8
2009-9
2009-10
2009-11
2009-12
2010-1
2010-2
2010-3
2010-4
2010-5
2010-6
2010-7
2010-8
2010-9
2010-10
2010-11
2010-12
2011-1
2011-2
2011-3
2011-4
2011-5
2011-6
2011-7
2011-8
2011-9
2011-10
2011-11
2011-12
2012-1
2012-2
2012-3
2012-4
2012-5
2012-6
2012-7
2012-8
2012-9
2012-10
2012-11
|
6.69
5.81
5.23
4.52
3.94
3.50
3.83
3.81
3.39
3.15
3.01
4.02
3.70
5.33
5.81
5.33
4.29
4.03
4.15
4.81
4.62
4.31
3.90
3.43
3.73
4.24
4.49
4.09
3.97
4.24
4.30
4.53
4.42
4.05
3.89
3.57
3.24
3.16
2.67
2.51
2.16
1.95
2.43
2.46
2.96
2.84
2.85
3.31
3.34
| | |
|
| |

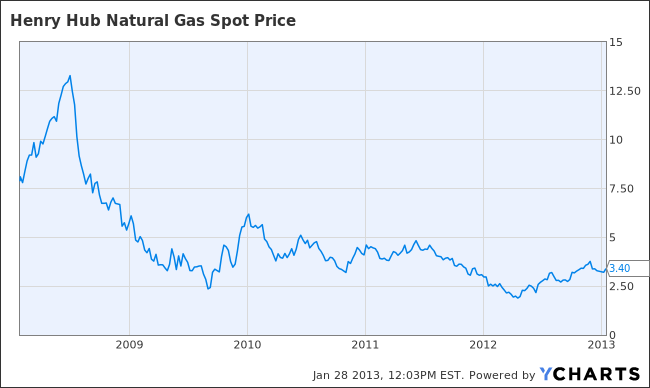
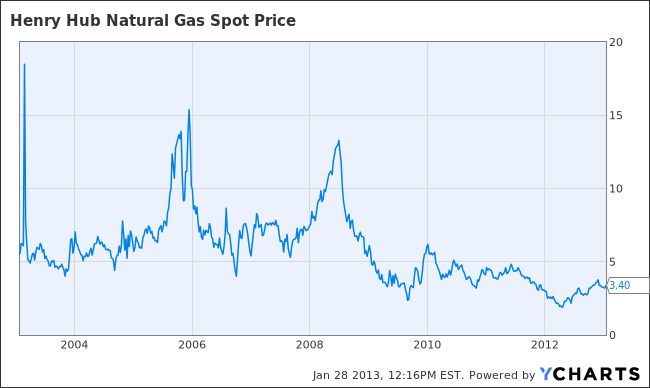 NATURAL GAS ONE YEAR CHART - ( India Infoline Limited - IIFL, Edathirinji )